
Your sales, at a glance.
A dashboard with what you need to decide: sales, tickets, hours, products and staff.
Revenue & average ticket
Net revenue, number of tickets and average ticket for the period.
Hours & weekdays
Your busiest hours and days, from opening to after midnight.
Products & categories
Best sellers and the share of each category. Tap a category to see its products.
Payment methods
Cash, card, Bizum and transfer, with refunds shown apart.
Staff & tables
Sales per waiter and per table.
Compare periods
This week, this month, this year against the previous one.
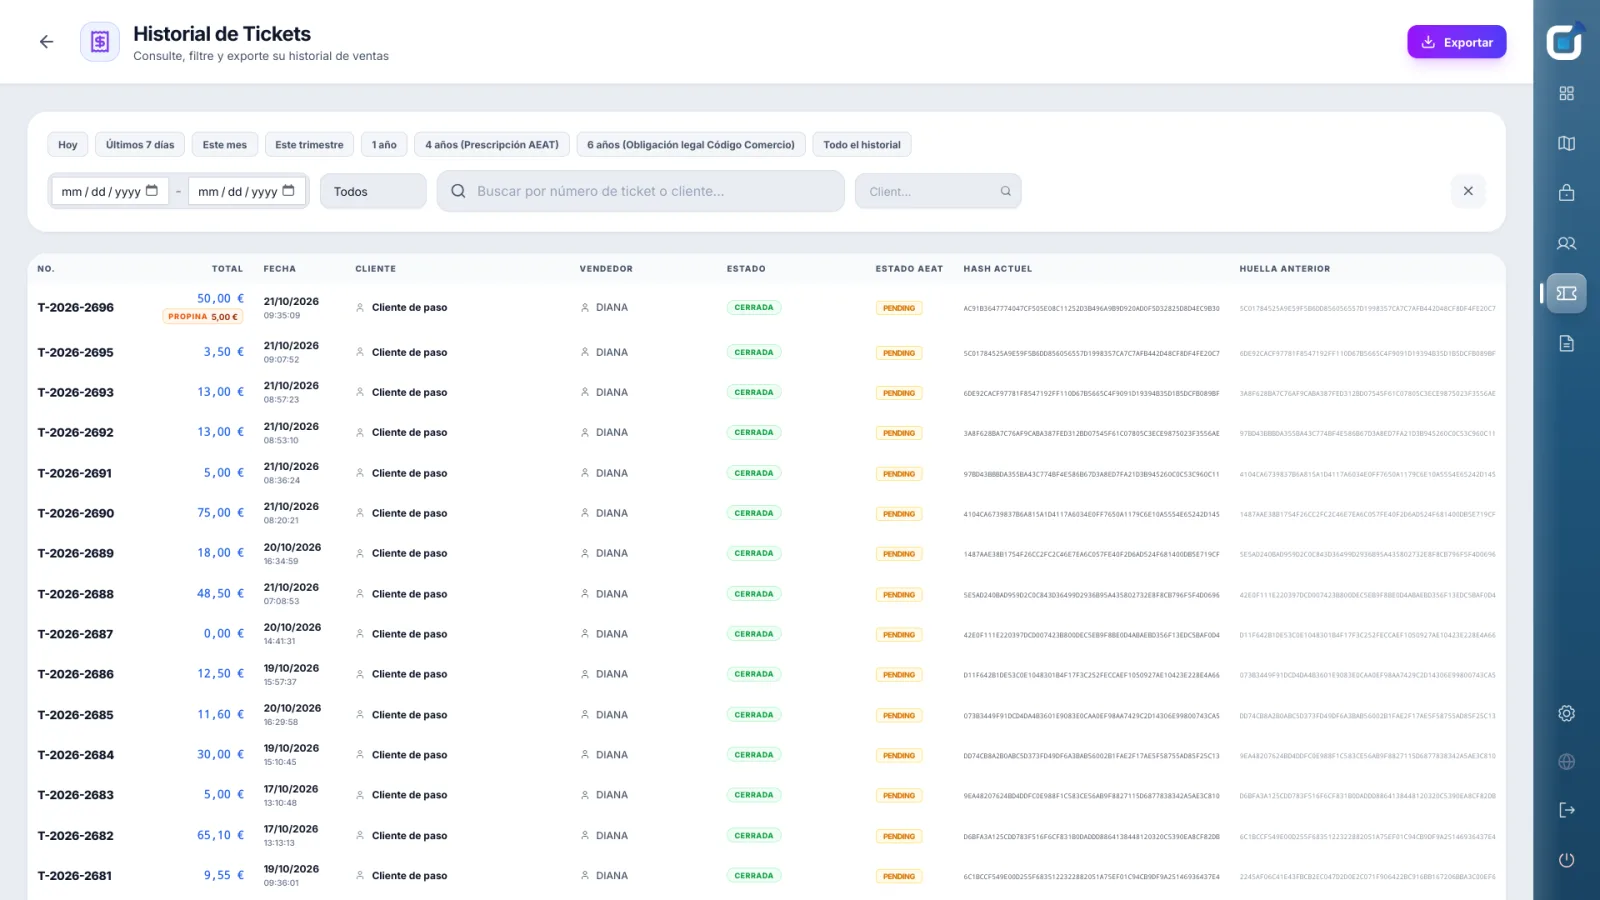
Every ticket, findable.
Ticket history with filters by date, amount, table and waiter. Reprint a ticket or turn it into an invoice.
- CSV export
- Works offline, on the main station
Questions
Do statistics work without internet?
Yes, they are calculated on your main station.
Who can see them?
Administrators only.
Can I compare with last month?
Yes, every period can be compared with the previous one.
Are refunds included?
Yes, shown separately so the net figure is right.
Related features
Ready when
you are.
See TPVStream with your own menu in a free demo.